Academic Task One: Graph
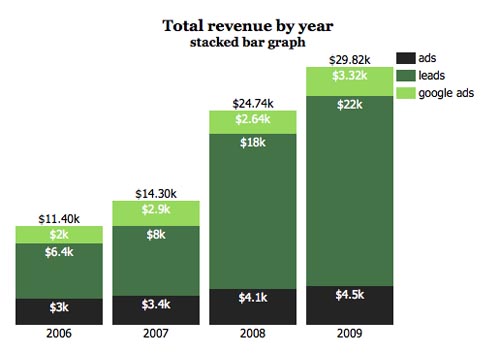
The graph shows the total revenue by year from 2006 to 2009 through ads, leads and google ads.
In terms of ads, we can see a gradual but steady increase throughout the period in question from $3k in 2006 to $4.5k in 2009.
This is in contrast to the revenue from leads which grew significantly over the same period with a particularly sharp jump from 2007 to 2008, the figures for which are $8k and $18k respectively, when revenue almost doubled. Revenue from leads started at $6.4k in 2006 and finished at $22k three years later.
Finally, if we look at google ads, we find there too a slow climb from $2k to $3.32k. This is a slight smaller rise than that found in ads.
Regarding revenue in general, it went up from a sum of $11.4k in the first year to a final total of $29.82k.
Overall, we can say that all aspects of revenue helped towards the noticeable rise. However, the contribution of ads and goodgle ads was rather minimal when compared with the huge expansion that can be seen in revenue from leads.
Image from this site