Task One Academic: Language of Graphs
In IELTS Writing Task 1 in the Academic Module, you often have to describe a graph. To do that, you need certain kinds of language:
- to describe movement in graphs
- to describe periods of time
- to describe comparisons
Here we will look at describing movement in graphs. Click above to see the other worksheets.
There are three main types of movement in graphs:
- going up
- going down
- no movement
 Going Up
- rise
- increase
- grow
- climb
 Going Down
- decrease
- drop
- fall
- decline
*All of these words can be used as verbs or nouns, except grow - the noun is growth.
- Sales dropped.
- There was a drop in sales.
Adjectives/Adverbs
To give you variety, you need to use more detail - you need to say how big or small the increase/decrease was. You can do this by using adverbs (with the verbs) and adjectives (with the nouns).
Small increase/decrease
- slightly/slight
- gradually/gradual
- moderately/moderate
- steadily/steady (if the change is consistent)
Big increase/decrease
- sharply/sharp
- dramatically/dramatic
- significantly/significant
- rapid/rapidly
Examples:
Sales dropped significantly. There was a significant drop in sales.
Sales rose slightly. There was a slight rise in sales.
You can also use other words to mean a big change:
- soar (increase a lot)
- rocket (increase a lot)
- plummet (decrease a lot)
*These words can only be used as verbs.
 No movement
- remain stable
- level off
- remain the same
Other useful vocabulary:
- reach a peak/peak (reach the highest point)
- reach a low (reach the lowest point)
- fluctuate (to move up and down rapidly)
- stand at (at one point)
Prepositions
You will also need to make sure that you use the correct prepositions. Look at the examples:
- Sales started at 10,000.
- Sales finished at 50,000.
- Sales remained stable at 40,000.
- Sales reached a peak at 70,000.
- Sales increased from 20,000 to 60,000.
- Sales increased by 40,000. (the difference of the increase)
- There was an increase of 40,000 in sales.
Approximate language
Graphs are not exact. You need to be able to use language to show that. This also gives you the opportunity to put more variety in your answer. Look at the sentences below - the numbers in brackets are examples.
- Sales started at roughly/approximately 50,000. (50,400)
- Sales peaked at just over 70,000. (70,200)
- Sales peaked at well over 70,000. (70,800)
- Sales finished at just under 70,000. (69,800)
- Sales finished at well under 70,000. (69,200)
TASK
Look at the graph below. Write a detailed description of each part of the graph. Remember that in the test you will concentrate only on the key points. However, for this task, the point is to practise the language.
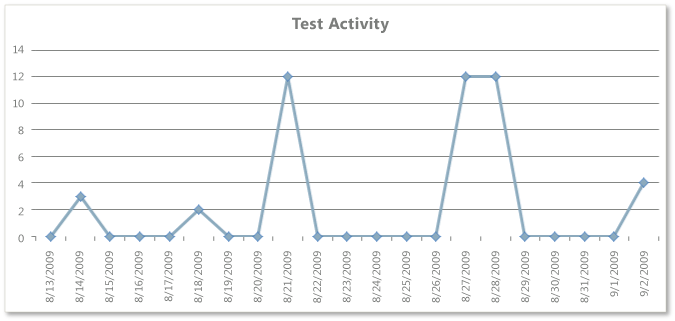
Image from this site